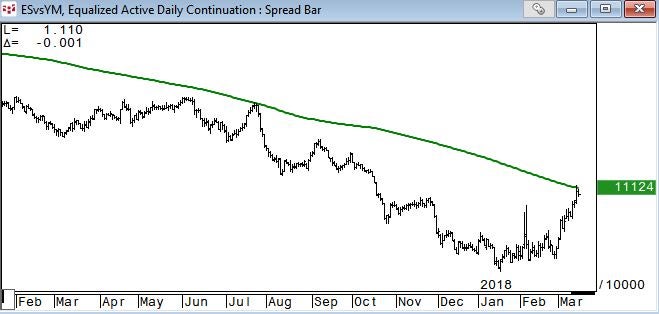
Large caps have been underperforming in March as rotational plays take over from the safety of large caps. This and the risk of a trade war with China is having a negative impact on large caps like Boeing Co BA 0.07% which fell below its 50-day moving average Wednesday for the first time in almost a year. The chart below is E-Mini S&P 500 futures relative to Dow Industrials futures, or ESM8/YMM8. Look for some unwind of the current rotation after ES vs YM hit the pivotal 200-day moving average in the pair yesterday.
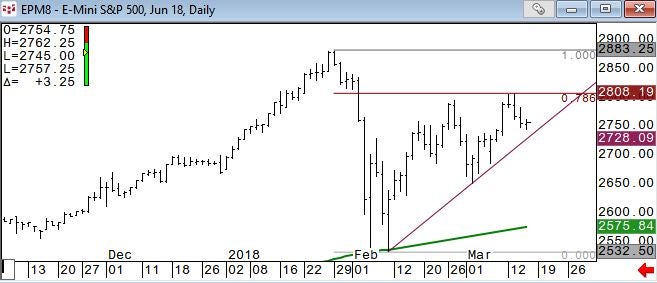
We have key levels in ESM8 at 2762.50, 2783.50, and 2808 (EPM8 is the symbol for the S&P 500 futures in the CQG platform).
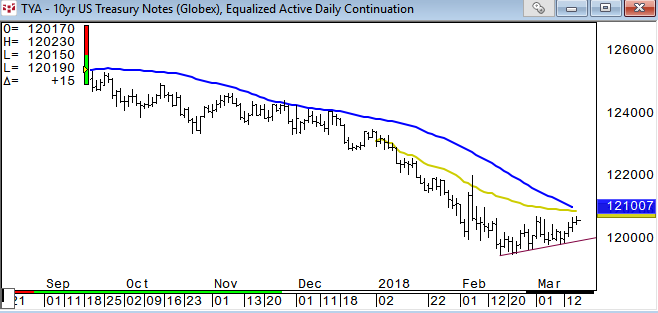
Here are two key charts in the fixed income market. The first is the 10-year U.S. Treasury Note futures, TYM8, which has a March high at 120-23 as initial resistance. More importantly, the 50-day moving average at the 120-131 area is also the VWAP of the year in the futures. The 50-day moving average in the 10-year yield is 2.75 percent.
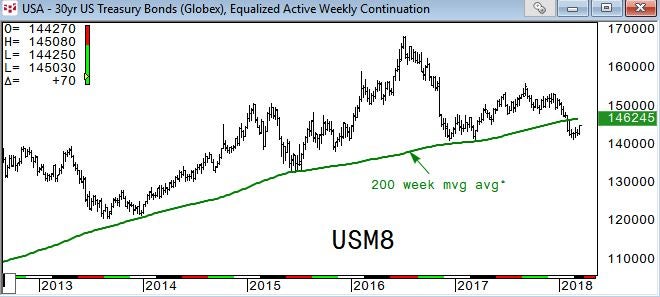
The 30-year U.S. Treasury Note futures, USM8, is showing a positive short-term trend above 144-21 and has 145-17 as next resistance. The 200-week moving average at 146-26* is major resistance above just in case we get there.
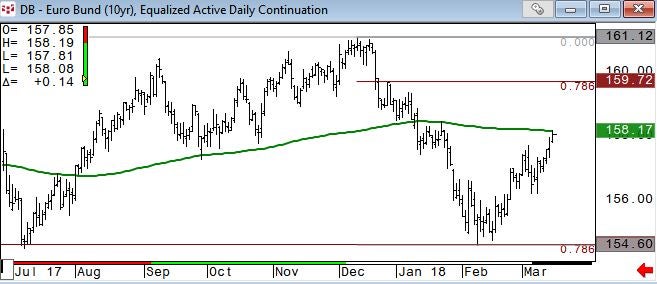
The Euro-Bund is helping lift US treasuries after it held a .786 potential reversal support level for a second time on February 8. The Bund now has its 200-day moving average which has been a pretty good short term pivotal point as key resistance, and any further equity weakness would likely see momentum above the 200-day to test the 159.72 level.
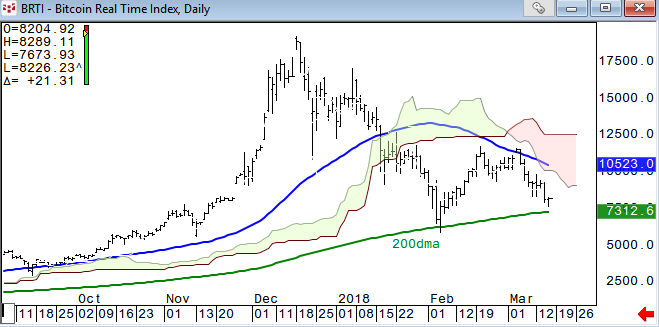
The Bitcoin Real-Time Index held below the 50-day moving average (blue line) and cloud resistance area that we were using as key resistance after the +99 percent rally off the early February low. It will need to hold above its 200-day moving average (7312) at least on a closing basis or risk a technical breakdown.