[vc_row][vc_column][vc_column_text css_animation=”fadeInDown”]
Hammer & Hangman Candles
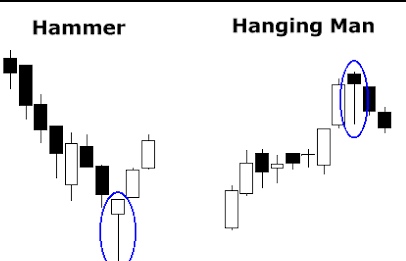
The hanging man and the hammer are both candlestick patterns that indicate trend reversal. The only difference between the two is the nature of the trend in which they appear. If the pattern appears in a chart with an upward trend indicating a bearish reversal, it is called the hanging man. If it appears in a downward trend indicating a bullish reversal, it is a hammer. Apart from this key difference, the patterns and their components are identical. Both consist of a single candlestick with a real body near the top of the candle, a long lower wick at least twice the length of the body and little to no upper wick. The color of the candlestick in either scenario is of no consequence.
The length of the lower wick is of primary importance as it indicates the demand for the underlying security pushed the price toward the upper third of the trading range for that period. Typically, this is considered a bullish signal. Thus, being a bearish reversal pattern, it is important to establish confirmation of the hanging man before entry. Ideally, confirmation is established in the form of a subsequent candle with a closing price below the real body of the hanging man.
Because the hammer is a bullish reversal pattern, confirmation may not be as vital. This is because the long lower wick indicates that while sellers may have been in control early in the session, driving prices down in keeping with the bearish trend, new buyers closed the period driving prices back to the upper third of the range. However, as with all trades, seeking confirmation from subsequent candles or other technical indicators such as the Relative Strength Index (RSI) or trading volume is always advisable.
[/vc_column_text][vc_column_text css_animation=”fadeInLeft”]
THE HAMMER
One of the most visually compelling candlestick patterns is the hammer candle. This signal is easily recognized by the lower wick also known as the tail that protrudes to the downside after an extended downtrend.
The hammer is comprised of one candle and it is easily identified by the presence of a small body with a wick at least two times greater than the body. It is found at the bottom of a downtrend and this shows evidence that the bulls started to step in. The color of the small body is not important but a white or green candle has slightly more bullish implications than a black or red body. A positive day is then required the following day to confirm this signal.
Criteria for the hammer signal
* The lower wick should be at least two times the length of the body.
* The real body is at the upper end of the trading range. The color of the body is not important although a white or green body should have slightly more bullish implications.
* There should be no upper shadow or a very small upper shadow.
* The following day needs to confirm the hammer signal with a strong bullish day.
Signal Enhancements
* The longer the lower wick the higher the potential of a reversal occurring.
* A gap down from the previous day’s close sets up for a stronger reversal move as long as the day after the Hammer signal opens higher.
* Large volume on the Hammer day increases the chances that a blow-off day has occurred.
Pattern Psychology
After a downtrend has been in effect the atmosphere is very bearish. The price opens and starts to trade lower. The bears are still in control but the bulls then step in and they start to bring the price back up towards the top of the trading range. This creates a small body with a large lower shadow and represents that the bears could not maintain control. The long lower wick now has the bears questioning whether the decline is still intact and a higher open the next day would confirm that the bulls had in fact taken control.
Take advantage of the benefits that Japanese Candlestick trading provides. Opportunities are easily identified and someone will take advantage of the information the signals provide even if you don’t. Once you learn the valuable benefits revealed by Candlestick formations the rewards will be overwhelming.[/vc_column_text][vc_raw_html]JTNDY2VudGVyJTNFJTBBJTNDc2NyaXB0JTIwYXN5bmMlMjBzcmMlM0QlMjIlMkYlMkZwYWdlYWQyLmdvb2dsZXN5bmRpY2F0aW9uLmNvbSUyRnBhZ2VhZCUyRmpzJTJGYWRzYnlnb29nbGUuanMlMjIlM0UlM0MlMkZzY3JpcHQlM0UlMEElM0MlMjEtLSUyMFNjYWxwJTIwcmVkJTIwYXV0byUyMC0tJTNFJTBBJTNDaW5zJTIwY2xhc3MlM0QlMjJhZHNieWdvb2dsZSUyMiUyMCUyMCUyMCUyMHN0eWxlJTNEJTIyZGlzcGxheSUzQWJsb2NrJTIyJTBBJTIwJTIwJTIwJTIwJTIwZGF0YS1hZC1jbGllbnQlM0QlMjJjYS1wdWItMjkwNTE4MjMzOTAwMjg5MCUyMiUwQSUyMCUyMCUyMCUyMCUyMGRhdGEtYWQtc2xvdCUzRCUyMjk1NDA1MjcyMzElMjIlMEElMjAlMjAlMjAlMjAlMjBkYXRhLWFkLWZvcm1hdCUzRCUyMmF1dG8lMjIlM0UlM0MlMkZpbnMlM0UlMEElM0NzY3JpcHQlM0UlMEElMjhhZHNieWdvb2dsZSUyMCUzRCUyMHdpbmRvdy5hZHNieWdvb2dsZSUyMCU3QyU3QyUyMCU1QiU1RCUyOS5wdXNoJTI4JTdCJTdEJTI5JTNCJTBBJTNDJTJGc2NyaXB0JTNFJTBBJTNDJTJGY2VudGVyJTNF[/vc_raw_html][/vc_column][/vc_row][vc_row][vc_column][vc_column_text css_animation=”fadeInLeft”]
THE HANGMAN
The hanging man is comprised of one candle and it is easily identified by the presence of a small body with a wick at least two times greater than the body. It is found at the top of an up-trend and the probability of making a correct trade becomes extremely high when utilizing this signal. The Japanese named this pattern the hanging man because it looks like a head with the feet dangling down.
Criteria for hanging man
* The upper wick should be at least two times the length of the body.
* The real body is at the upper end of the trading range. The color of the body is not important although a black or red body should have slightly more bearish implications.
* There should be no upper shadow or a very small upper shadow.
* To confirm the hanging man signal a black candle should be seen the following day. An even better confirmation of this signal is to see a gap down with a lower close.
Signal Enhancements
* The longer the lower wick the higher the potential of a reversal occurring.
* A gap up from the previous day’s close sets up for a stronger reversal provided prices trade lower the day after the hanging man signal is formed.
* Although it is not a necessity a large volume on the signal day increases the chances that a blow-off day has occurred.
Pattern Psychology
After a strong up-trend has been in effect the atmosphere is bullish. The price opens higher but then begins to move lower. The bears take control but before the end of the day the bulls step in and take the price back up to the higher end of the trading range. This creates a small body for the day and could indicate that the bulls still have control. The long lower wick however represents that sellers have started stepping in at these levels. Even though the bulls may have been able to keep the price positive, by the end of the day the evidence of selling is apparent. A lower open or a black or red candle the[/vc_column_text][vc_raw_html]JTNDY2VudGVyJTNFJTBBJTNDc2NyaXB0JTIwYXN5bmMlMjBzcmMlM0QlMjIlMkYlMkZwYWdlYWQyLmdvb2dsZXN5bmRpY2F0aW9uLmNvbSUyRnBhZ2VhZCUyRmpzJTJGYWRzYnlnb29nbGUuanMlMjIlM0UlM0MlMkZzY3JpcHQlM0UlMEElM0MlMjEtLSUyMEJsdWUlMjBiYW5uZXIlMjAtLSUzRSUwQSUzQ2lucyUyMGNsYXNzJTNEJTIyYWRzYnlnb29nbGUlMjIlMEElMjAlMjAlMjAlMjAlMjBzdHlsZSUzRCUyMmRpc3BsYXklM0FpbmxpbmUtYmxvY2slM0J3aWR0aCUzQTk3MHB4JTNCaGVpZ2h0JTNBMjUwcHglMjIlMEElMjAlMjAlMjAlMjAlMjBkYXRhLWFkLWNsaWVudCUzRCUyMmNhLXB1Yi0yOTA1MTgyMzM5MDAyODkwJTIyJTBBJTIwJTIwJTIwJTIwJTIwZGF0YS1hZC1zbG90JTNEJTIyOTU2NzcwOTYzMSUyMiUzRSUzQyUyRmlucyUzRSUwQSUzQ3NjcmlwdCUzRSUwQSUyOGFkc2J5Z29vZ2xlJTIwJTNEJTIwd2luZG93LmFkc2J5Z29vZ2xlJTIwJTdDJTdDJTIwJTVCJTVEJTI5LnB1c2glMjglN0IlN0QlMjklM0IlMEElM0MlMkZzY3JpcHQlM0UlMEElM0MlMkZjZW50ZXIlM0U=[/vc_raw_html][/vc_column][/vc_row]